Analysis
Contents
Analysis#
Growth#
Growth is a simple and straightforward measure to analyse at the behavior of a GRA.
Let us start with one of the minimal 3-regular graphs.
import gra

g = gra.minimal_regular_graphs(3)[2]
g.plot()
100% -> 3 graphs found

We can plot the growth of \(G\) under this rule using matplotlib.
import matplotlib.pyplot as plt

rule2236 = gra.Rule(3,2236)
time_max = 70

# initialize the list that will hold the succesive graph orders with the first value
growth = [g.order()]

# loop that evolves the graph then adds the new graph order to the list
for i in range(time_max):
    rule2236(g)
    growth.append(g.order())

# growth plot
plt.plot(growth)
plt.title('Growth of G0 under rule 2236')
plt.xlabel('time')
plt.ylabel('graph order')
plt.show()
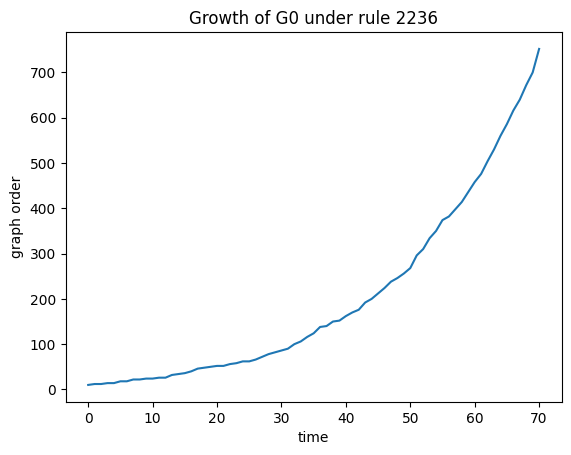
Here is the final graph of the sequence \(G_{70}\) :
g.plot()
